ydblogo
D A T A B A S E
yhologo

TELSTRA TODAY

  • Telstra Share Price - a sad history
  • 2018 Latest Financial Resulta
  • 2018 Business Unit Resulta
  • 2018 Mobile Customers
  • 2018 Labour Costs
  • 2018 CEO Remuneration

  • Telstra InfraCo Announcement<\a>

    TELSTRA HISTORY

  • Telstra History
  • Letterheads
  • Background

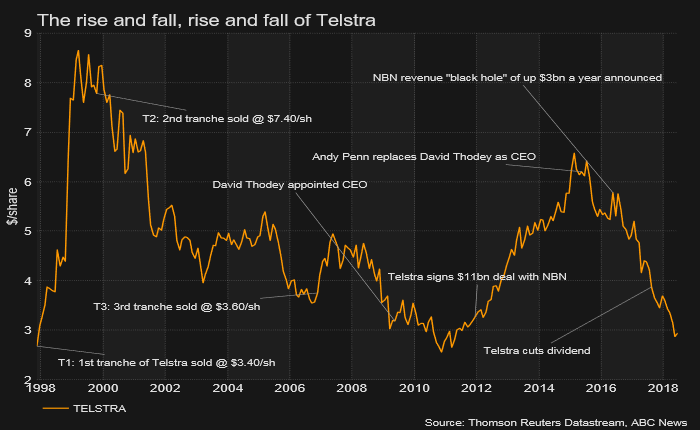
  • TELSTRA SHARE PRICE - A SAD HISTORY

    2018 LATEST FINANCIAL RESULTS

    Source: Telstra Annual Report 2018

    
    Continuing Operations	        2018      2017      2016      2015      2014
    Total Income                $29,042m  $28,205m  $27,050m  $26,112m  $26,296m
    Profit                      $ 3,529m  $ 3,874m  $ 3,832m  $ 4,114m  $ 4,549m 
    Dividends per share            22.0c     31.0c     31.0c     30.5c     29.5c 
                                  
    Continuing Operations 1	        2018      2017      2016      2015      2014
    Total income excluding      $29,042m  $28,205m  $27,050m  $26,112m  $26,296m
      excluding finance income                                                  
    EBITDA 2 		    $10,121m  $10,679m  $10,465m  $10,533m  $11,135m
    EBIT 3 	 	            $ 5,651m  $ 6,238m  $ 6,310m  $ 6,559m  $ 7,185m
    Profit for the period from  $ 3,529m  $ 3,874m  $ 3,832m  $ 4,114m  $ 4,549m 
      continuing operations                                                     
    Profit for the period from  $     -m  $     -m  $ 2,017m  $   191m  $  -204m
      discontinued operations 4                                                 
    Profit from continuing and  $ 3,529m  $ 3,874m  $ 5,849m  $ 4,305m  $ 4,345m
      discontinued operations                                                   
    Dividends declared per         22.0c     31.0c     31.0c     30.5c     29.5c 
      share (cents)                                                             
    Total assets                $42,870m  $42,133m  $43,286m  $40,445m  $39,360m
    Gross debt                  $15,368m  $16,218m  $16,009m  $14,962m  $16,048m
    Net debt                    $14,739m  $15,280m  $12,459m  $13,566m  $10,521m
    Total equity                $15,014m  $14,560m  $15,907m  $14,510m  $13,960m
    Capital expenditure 5       $ 4,717m  $ 4,606m  $ 4,045m  $ 3,589m  $ 3,661m 
    Free cashflow               $ 4,695m  $ 3,496m  $ 5,926m  $ 2,619m  $ 7,483m 
    Earnings per share (cents)     30.0c     32.5c     47.4c     34.5c     34.4c
    Dividend payout ratio (%)6       73%       95%       65%       88%       86% 
    

    Notes:
    1.Represented the Autohome Group being classified as a discontinued operation.
    2.Operating profit before interest, depreciation and amortisation and income tax expense. EBITDA is used as a measure of financial performance by excluding certain variables that affect operating profits but which may not be directly relate to all financial aspects of the operations of the company. EBITDA is not a measure of operating income, operating performance or liquidity under A-IFRS. Other companies may calculate EBITDA in a different manner to us.
    3.EBITDA less depreciation and amortisation.
    4.Profit/(loss) for the year from discontinued operations for FY15 and FY16 included both Sensis and Autohome Group results, while FY14 and FY13 only included Sensis results.
    5.Capex is defined as additions to property, equipment and intangible assets including capital lease additions, excluding expenditure on spectrum, measured on an accrued basis. Excludes externally funded capex.
    6.Dividend payout ratio from continuing and discontinued operations. Dividend payout ratio from continuing operations FY16: 98%

    BUSINESS UNIT RESULTS

    Source: Telstra Annual Report 2018

    
    Total external income 			FY18      FY17       Change

    Telstra Consumer and Small Business $14,683m $14,722m -0.3% Telstra Enterprise $ 8,249m $ 8,108m 1.7% Telstra Wholesale $ 2,737m $ 2,837m -3.5% Telstra Operations $ 1,217m $ 1,151m 5.7% All Other $ 2,156m $ 1,387 55.4% Total Telstra segments $29,042m $28,205 3.0%

    MOBILE CUSTOMERS

    Source: Telstra Annual Report 2018

    2016	17.2m
    2017	17.4m
    2018	17.7m
    

    LABOUR COSTS

    Source: Telstra Annual Report 2018

    Labour

    Total labour expenses decreased by 4.2 per cent or $224 million to $5,157 million. Redundancy costs decreased by 47.9 per cent or $150 million resulting from higher restructuring related costs in FY17, while labour substitution costs decreased by 6.1 per cent or $59 million due to a reduction in labour outsourcing. Salary and associated costs decreased by $9 million or 0.2 per cent.

    Total full time staff and equivalents (FTE) remained steady at 32,293, with an increase in domestic FTE offset by an offshore reduction.

    
    Operating expenses 	FY18 	   FY17 	Change

    Labour $ 5,157m $ 5,381m -4.2% Goods and services $ 8,758m $ 7,671m 14.2% Other expenses $ 4,984m $ 4,506m 10.6% Total operating expense $18,899m $17,558m 7.6% Staff FTE 32,293 32,293 0%

    CEO REMUNERATION

    Source: Telstra Annual Report 2018

    The report shows a pay reduction. However a later table exposes more income.

                        Fixed    Non Monet  EVP/STI    STI      LTI       TOTAL
    2017 Andrew Penn    $2,325k  $ 9k       $1,486k    $349k    $    0k   $3,745k
    2018 Andrew Penn    $2,374k  $ 5k       $1,103k    $263k    $1,039k   $5,208k
    
          Salary  EVP     NonMon  Super  Leave  Shares  Rights  TOTAL 
    2018  $2,354k $1,103k $   5k  $ 20k  $ 59k  $ 672k  $  305k $4,518k
    2017  $2,305k $1,486k $   9k  $ 20k  $ 57k  $ 464k  $1,319k $5,660k
    
    Maximum potential EVP opportunity for Andy Penn in 2018 is $9,560,000.

    EVP Executive Variable Remuneration Plan
    STI Short Term Incentive


    Home
    Telecom